ALOS-2/PALSAR-2 Observation Results on M 6.2 earthquake in central Italy
Posted: August 25, 2016, 8:00 (UTC)
On August 24, 2016 at 23:00 (UTC), an emergency observation with the Phased Array-type L-band Synthetic Aperture Radar-2 (PALSAR-2) aboard the Advanced Land Observing Satellite-2 (ALOS-2, “DAICHI-2”) was performed in response to the magnitude-6.2 earthquake in central Italy on August 24, 2016 at 1:36 (UTC). Japan Aerospace Exploration Agency (JAXA) has provided the acquired data to corresponding authorities.
| Observation date (UTC) | Path No. | Observation mode | Polarization | Direction | Beam No. |
| 2016/08/24 | 197 | Stripmap 10 m | HH+HV | Right | F2-7 |
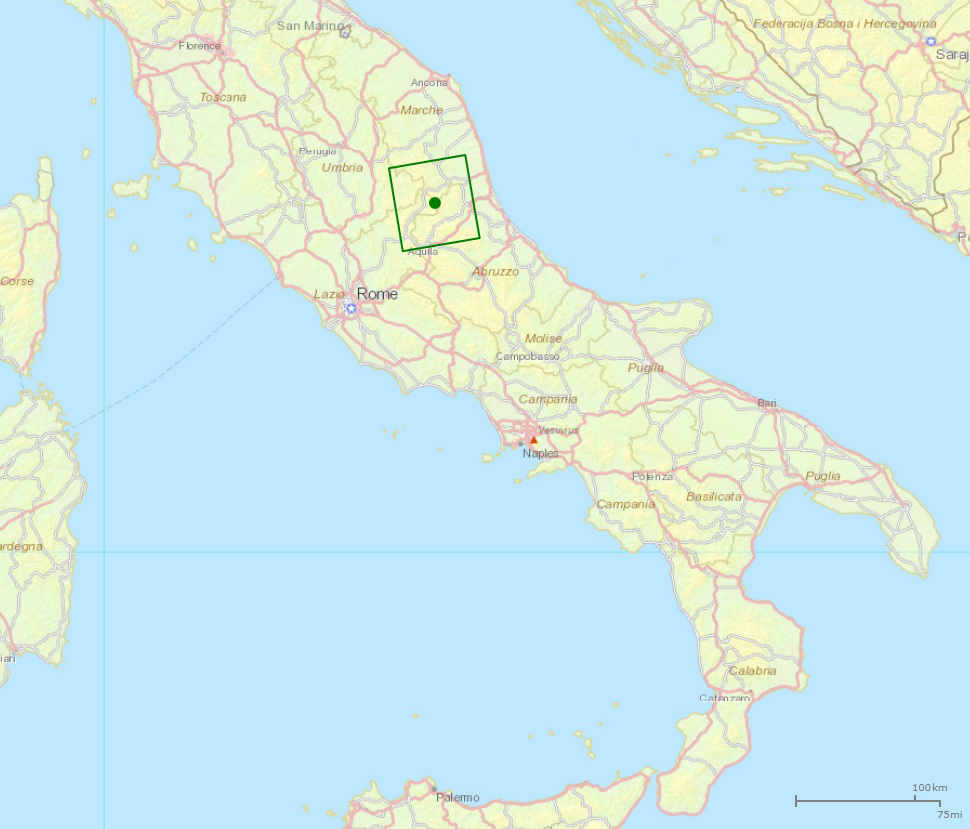 Fig.1: Area of the emergency observation
(Click to view enlarged image)
Fig. 2 shows a differential interferometry (DInSAR) result derived from the PALSAR-2 data acquired before (September 9, 2015; UTC) and after (August 24, 2016; UTC) the earthquake. Approximately 15 cm deformation away from the satellite (eastward movement and / or subsidence) is detected in the east region of the epicenter. The deformation area extends approx. 20 km from north to south and 10 km from west to east. The city of Amatrice places its south end.
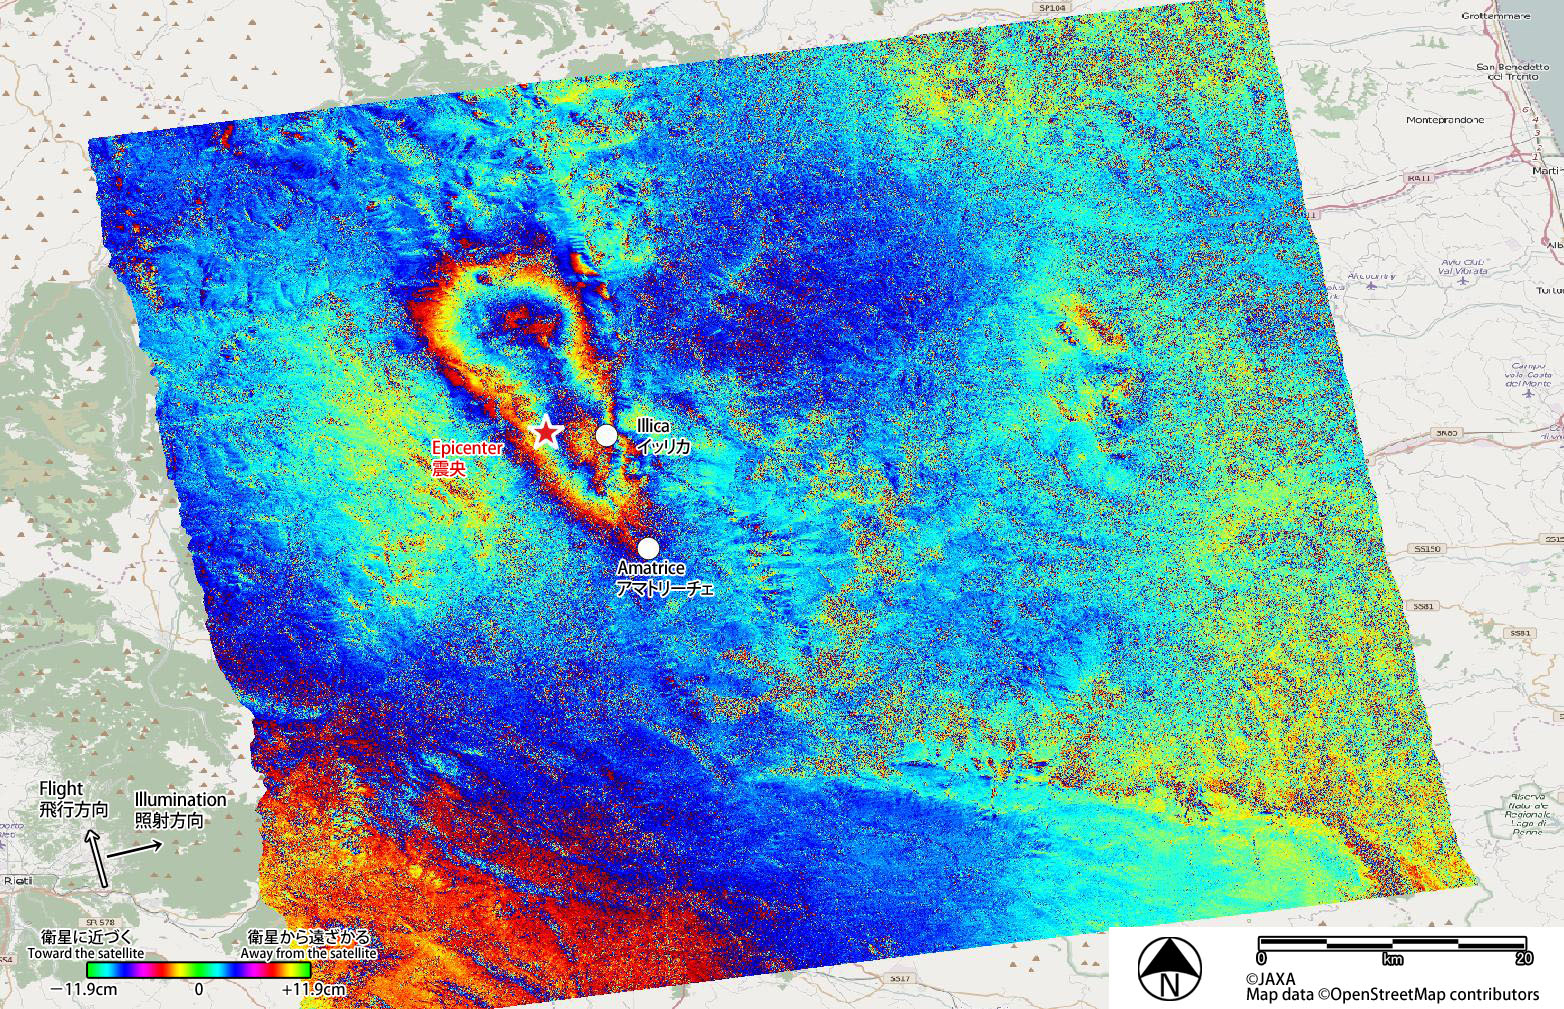
Fig.2: Differential interferometry (DInSAR) result using the ALOS-2 PALSAR-2 data acquired before (September 9, 2015; UTC) and after (August 24, 2016; UTC) the earthquake.
(Click to view enlarged image)
Fig. 3 and Fig. 4 show the damage proxy map of Amatrice and Illica generated by comparing the interferometric coherence values before and after the earthquake. The dense orange parts illustrate significant decrease of coherence caused by surface changes including collapse of buildings.
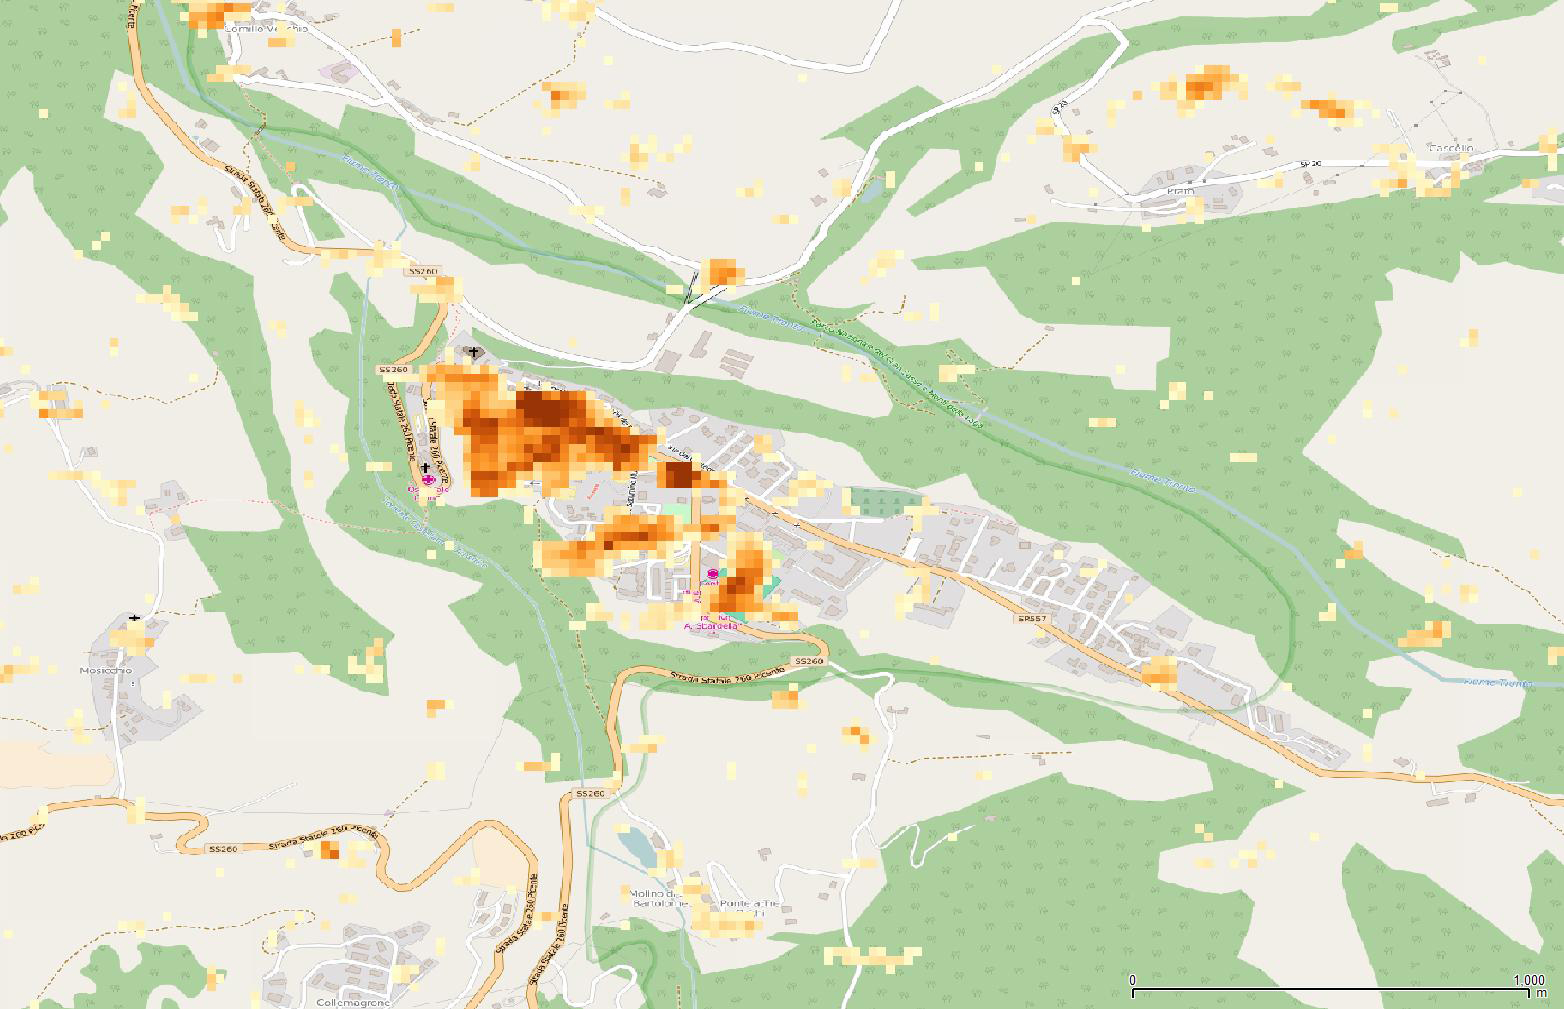
Fig.3: Damage proxy map of Amatrice generated by the interferometric coherence change analysis.
(Click to view enlarged image)
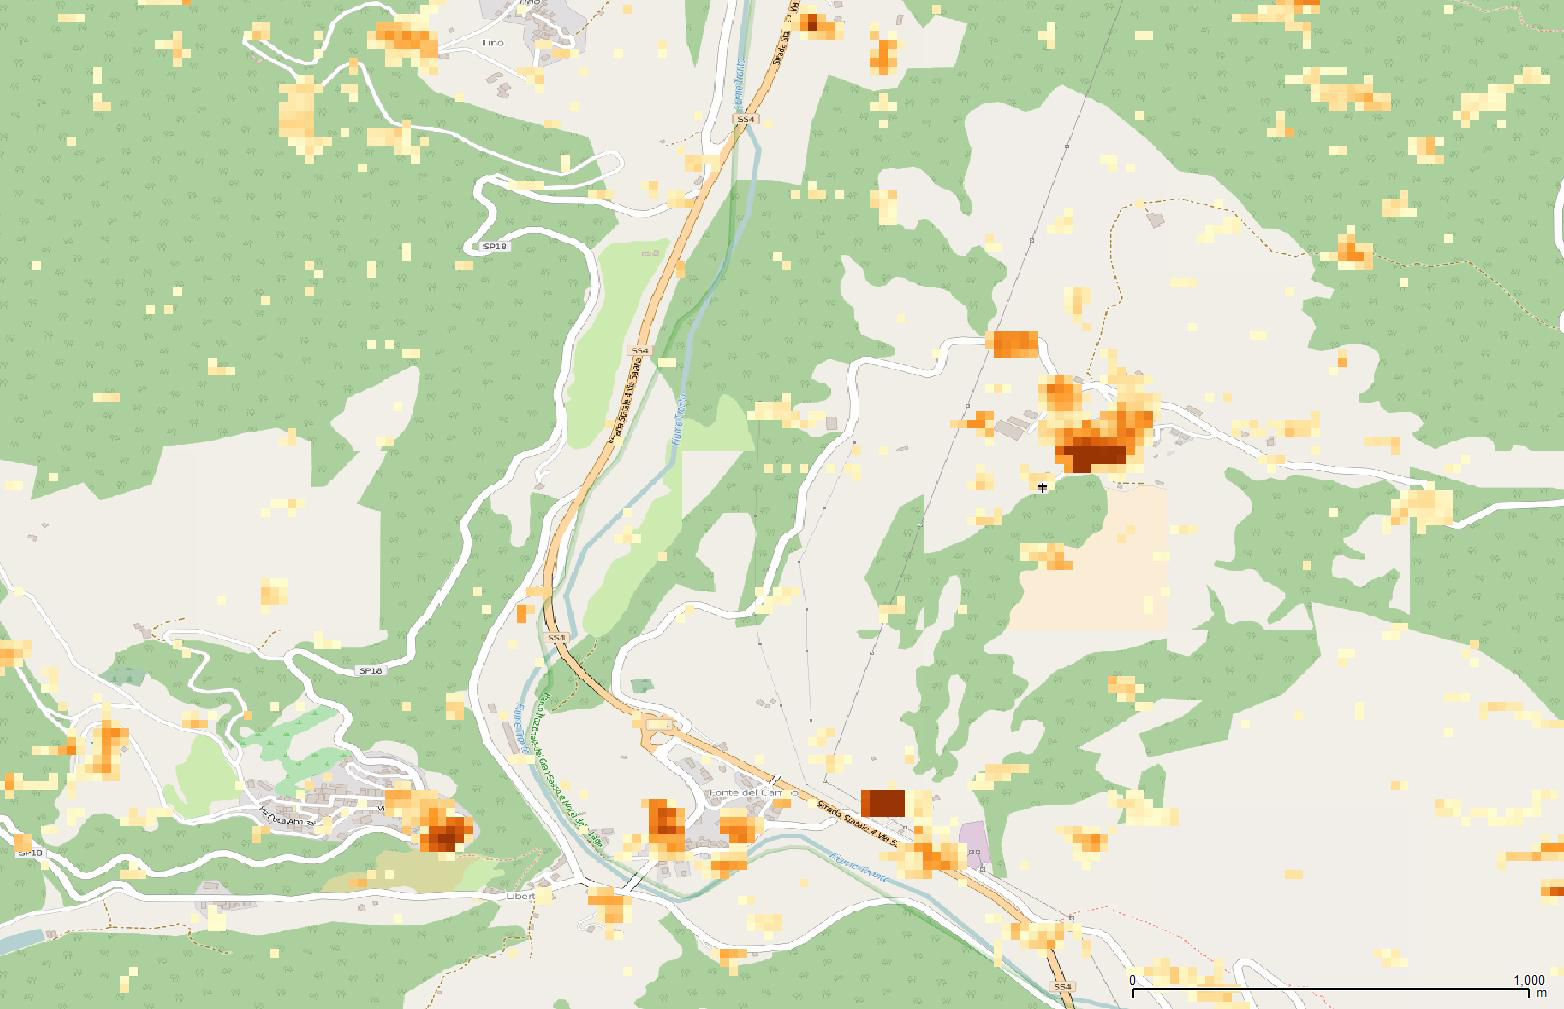
Fig.4: Damage proxy map of Illica generated by the interferometric coherence change analysis.
(Click to view enlarged image)
© JAXA EORC
Comments are closed.